To better estimate the situation with СOVID-19 within our company LEDAS, we decided to make antibody testing available to our employees who work remotely since March. Fifty-three of our 70+ employees were interested, and so we organized out-of-lab testing thanks to Invitro’s laboratory service. Both IgM (early antibodies) and IgG (late antibodies) were examined, and the results were simple: all had zero positives for IgM, and one employee was positive for IgG.
We were able to congratulate ourselves for the zero result in early antibodies, meaning we are quite safe. But now we needed to focus on the late antibodies, as they provide more interesting information. Since we at LEDAS are now involved in more medical software projects, we considered this an opportunity to apply statistics to our medical data.
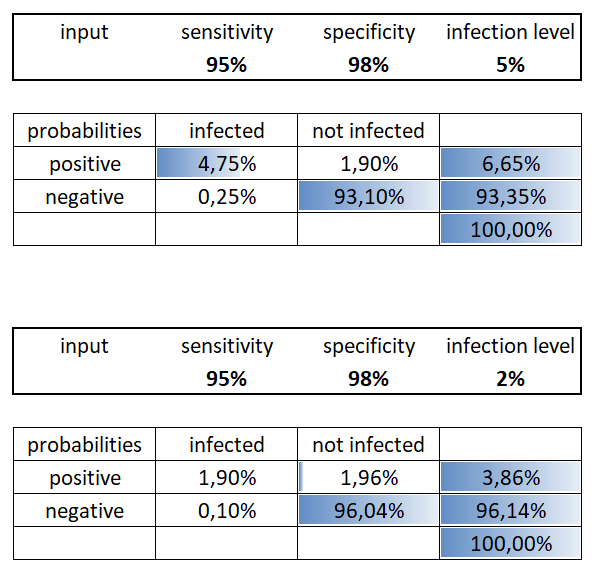
It is important to keep in mind that the accuracy of SARS-CoV-2 antibody (ELISA) tests is not very high: the sensitivity (true positive rate) of our tests was ~95% and the specificity (true negative rate) was ~98%. These are due to the lack of a perfect verification procedure, because double-checking through PCR (polymerase chain reaction) testing is not precise either. The specificity could be increased more easily by using old blood samples collected before the coronavirus era, such as from 2019, which could be considered non-infected.
Statistics are more accurate when working with big numbers, and so results for groups are more meaningful. By contrast, individual results are not particularly indicative; for individuals, they could be even counter-intuitive. I’ll look at both cases.
Individual Results
Let’s assume that the general level of infection in the population is L=5%. This corresponds to results from a nationwide study in Spain published recently in the Lancet journal. Spain is one of the highly infected countries.
When someone gets a positive result, there are two possible reasons that are mutually exclusive:
- TP – there is an infection, and the test is a true positive (accurate)
- FP – there is no infection, but the test is a false positive (inaccurate)
The probabilities P (TP) and P (FP) are calculated in this way:
- P (TP) = level of infection * sensitivity = 0.05 * 0.95 = 0.0475
- P (FP) = (1 – level of infection) * (1 – specificity) = 0.95 * 0.02 = 0.019
The probability of getting a positive test P (Positive) is the sum of the two probabilities:
P (Positive) = P (TP) + P (FP) = 0.0475 + 0.019 = 0.0665
This means that if you are in Spain (or in another country with the same level of infection), and you applied for a test of this type, then you have a 6.65% chance of getting a positive result.
What can we conclude from this? That we should apply the conditional probability formula to measure your chances:
P (TP / Positive) = P (TP ∩ Positive) / P (Positive) = P (TP) / P (Positive).
The probability that you are actually infected in the case where you received a positive test will be approximately
P (TP / Positive) = 0.0475 / 0.0665 = 0.714…
So, before taking a test in Spain, you have a 5% probability of having been infected; after testing, despite getting a positive result, you still have only a ~71.4% probability of being actually infected. Your chance of being not infected after a positive result is ~28.6% – not so small!
So what is the benefit of testing for the virus? To understand this, we should consider how the probability of being infected changes when the result is negative. Once again, there are two possible reasons for testing negative:
- FN – a patient is infected, but the test was false negative
- TN – a patient is not infected, and the test was true negative
The probabilities are:
- P (FN) = level of infection * (1 – sensitivity) = 0.05 * 0.05 = 0.0025
- P (TN) = (1 – level of infection) * specificity = 0.95 * 0.98 = 0.931
The probability of getting a negative test is the sum of the two:
P (Negative) = 0.0025 + 0.931 = 0.9335
This conforms with the 0.0665 probability of getting a positive test result, as P (Positive) + P (Negative) = 1.
The probability that you are actually infected when you test negative is
P (FN / Negative) = P (FN ∩ Negative) / P (Negative) = P (FN) / P (Negative) = 0.0025 / 0.9335 = 0.0026…
So, while before test you had 5% of probability of having been infected, after getting the results you have either
- 71.4% of probability of being infected, if the result is positive, or
- 0.26% of probability of being infected, if the result is negative
In the one case, you increase the probability by an order of magnitude; in the other one you decrease it by an order of magnitude. The difference is significant!
It is easy to see that if the specificity of the test somehow decreases to less than 95%, then even after getting a positive result you will have less than a 50% chance of being truly infected, which is rather counter-intuitive.
Group Results
The results for our test group can be described using a binomial distribution. Let’s input our parameters P (Positive) and N=53 and see what WolframAlpha tells about this:
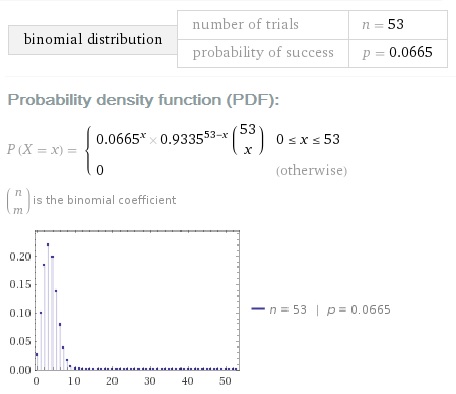
What is the probability that there were no infected employees in our company, given one positive? For this to be true, 53 test conditions should be satisfied simultaneously and independently:
- One condition (the only positive result) is actually a false positive; the probability of this is P (FP / Positive)
- 52 conditions (the negative results) of which each is actually a true negative; the probability of this is P (TN / Negative)
The product of these 53 Bayesian probabilities is
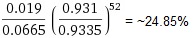
So we have a not-so-small 25% chance that no one was infected.
What is the probability that many employees were infected? This is not as easy to calculate, but it is easy to make an upper-bound estimate. To have more than N-infected employees, we should have at least N false negative tests, based the one unit of difference between them provided by the single positive result in all our antibody testing.
The probability of having N false negative tests is not more than
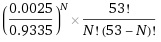
If N=2, it is already less than 1%, so it is highly unlikely that we have more than two infected employees. Using this formula, the probability of having exactly two infected employees is less than 14.2%.
Therefore, the hightest probability is that there is only one infected employee at LEDAS, as we have a 60+% chance for this. This implies that there was no transmission of the virus inside our company.
Some Notes About Assumptions
I did the computations with these assumptions:
- The statistical selection was done independently
- The percentage of people in the population that contracted coronavirus is 5%
The first assumption is, of course, not fully correct, because our employees had been working from home for a long time, and so have a low probability of being exposed to the virus. So, the selection was not independent.
The second assumption of 5% infection does not correspond to the official data for Novosibirsk region, in which our staff is located. As of mid-July, there were seven thousand cases among 2.8 million people, for an infection rate of about 0.25%. On the other hand, it is well-known that official testing data don’t include asymptomatic and false negative cases; this is true for all countries, and so Russia and Novosibirsk are not exceptions here.
We can adjust the infection rate without doing extensive antibody testing, but instead using estimates from the infection fatality rate (IFR). Some studies suggest that it should be within the range of 0.5-1%. The official number of coronavirus-caused deaths in the Novosibirsk region is 142 (as of July 12). We can calculate the number of all COVID-19 cases in the range of 14-28 thousand.
Unfortunately, these numbers look underestimated, as the official number of death cases might not be correct. For example, some deadly pneumonia cases are “false negatives” or are not considered to have been caused by COVID-19 as the primary cause of death.
Better estimates of lethal COVID-19 cases can be calculated by comparing the mortality of this year with that of the previous year, as was done by the Financial Times for certain countries and regions. The raw data is available on Github.
For the Novosibirsk region, the data (available elsewhere) suggests there were an additional 400 deaths in June 2020 (when compared with the monthly average for 2019). Of course, not all deaths this year can be attributed to COVID-19, but very probably it is the primary reason of the increase. Assuming that 300-400 deaths were due to COVID-19, then the number of all cases can be roughly estimated as 30-80 thousand per 2.8 million of people. This is in the range 1%-3%, and much higher than official data of 0.25%.
The numbers can be double-checked with a very different consideration: sociology and anthropology. The so-called Dunbar’s Number proposes that people can comfortably maintain about 150 relationships with other people.
Dunbar’s Number can be useful in understanding the level of disease spread in the population: if you know of no one among your friends or relatives who contracted the disease, then the likely number of cases is less than 1%. But if there is at least one person you know personally, then the rate is higher than 1%.
In our case, it looks like the 1-3% estimate is correct, as for many of us we know of two to three COVID-19 cases among friends and relatives. Very probably during the next few weeks and months, some of our employees will contract the disease as well, due to the increasing number of infected people in the general population.
Below you can see how the probabilities of different cases for one person change if we decrease the parameter “infection level” from 5% to 2% (midpoint of the 1-3% interval). It is interesting that for the positive result you have nearly 50:50% chances of true positive and false positive:
***
We believe that there were no transmissions inside our company, because we implemented remote work in March, well before there were any cases reported in our city. Restrictions from authorities began more than ten days later. And we are taking care to not contribute to transmission of the virus in the future.
Stay healthy, safe, and take care!
Read more:
Work From Home Yields Record-breaking Interest in LEDAS Cloud Platform
How LEDAS Set Up Remote-Working to “Flatten the Curve”
How LEDAS Teaches Via Distance Learning